By Brian Maskell
This article is from the Superfactory Archives, an archive of content from the Superfactory website that existed from 1997 to 2012.
This article is the second in a series about lean accounting methods. The series will be based on the newest book, published in October 2007, The Lean Business Management System; Lean Accounting Principles& Practices Toolkit.
In our practice at BMA Inc., when we first introduce lean accounting to companies, questions always arise, something along the lines of: "Well, that all makes sense, but how do you do it?" or "How do you get this past your auditors?" or "Is this really GAAP compliant?" and the like. This series of articles will examine details or "how to's" of this evolving discipline and show you how to put it to work in your company as a business management system that supports your lean manufacturing efforts seamlessly.
One key motivation for making the transition away from traditional cost accounting is to enable the accountants to support the lean manufacturing culture by providing information that is relevant and actionable so that lean continuous improvement is empowered at every level of the organization.
Lean accounting seeks to apply lean to the company’s accounting processes; and to create accounting, control, and measurement systems that support lean. In this article, we will address the first of these themes and will tackle questions like: “How do we make our accounting processes truly flow?” Or, “How do we eliminate waste from the accounting processes?” And “How do we make our accounting processes self-improving?”
The simple answer is that lean thinking and methods are applied to accounting processes in the same way they are applied to other processes; whether manufacturing, engineering, sales and marketing, healthcare, retail, banking, or industrial. But, not so fast. First, we have to see the waste. For this we need to map the processes. Second we must have standard methods for creating lean improvement. And third we must build a culture of continuous improvement leading to non-stop improvement.
The starting point for lean accounting is to recognize that all accounting, control, and measurement is 100% waste. There is nothing we do as accountants and controllers that adds value for the customers. This does not mean that our processes are unimportant – indeed many of them are vital to the company’s success. But it does mean that we need to work relentlessly to make these processes as little work as possible.
We are talking here about the typical accounting tasks of month-end close, accounts payable, accounts receivable, payroll, and financial reporting. We are also including such processes as purchasing and receiving, shop floor control and work orders, inventory tracking, and other systems that are used for both operational control and financial control. We can, of course, gain considerable benefit from improving the month-end close, etc. But the real “heavy hitters” for waste elimination are the complex, transaction-based processes surrounding documents like work orders, purchase orders, supplier invoices, customer invoices, and inventory valuation and control.
In the early stages of lean accounting our efforts will be focus on improving these processes: reducing the waste, improving the flow, and cutting costs. As we progress, our primary focus will be on eliminating the processes altogether. There are three categories of tools we apply to this task:
a. Value stream mapping and process mapping
b. Kaizen - lean continuous improvement
c. PDCA problem solving
We will treat each separately in this article.
a. Value Stream Maps and Process Maps
Value stream maps are commonly used to enable manufacturing people to understand the flow of production processes and to develop methods to improve the flow, reduce the waste, and cut costs. These same maps are used also in a wide range of industries, such as hospital processes, banking processes, logistics processes, etc. The true value stream map shows the entire process from beginning to end. It includes all the steps required to create value for the customers, and also includes a lot of steps that are thoroughly wasteful.
These maps usually include information about the accounting and support functions around the company’s major processes, but they do not give a great deal of detailed information. In order to understand the flow and the waste in our accounting and control processes we need to map one level deeper and create process maps of the processes we are responsible for and need to improve.
What Is a Process Map?
A process map is a diagram showing all the steps in a process. Each step is documented with relevant information about the step including such things as the cycle time to complete a task, the rework or failure rate, the amount of disturbance time (or interruption time) for the people, system downtime, and other information.
What does it do?
The process map lets us see the whole flow of the process and identify where there is waste and where the flow is compromised. The well-mapped and understood map also lets us use the information about each step to analyze the process, identify the amount of waste, and then understand what must be done to make improvement. The primary purpose of the process map is to develop a “future state” process map, one that shows the improvements we plan to make and leads to a detailed action plan for implementing the changes.
Why use it?
The primary reason for these maps is to develop realistic actions plan to improve the process, improve the flow, eliminate waste, and reduce the cost.
The activity of developing the process map with a team of people who have responsibility to improve process is very valuable. It enables the team to share their knowledge and thoroughly understand the process as a group. It is common for people who have worked in a process for many years to discover that they did not correctly understand it, or that they had a limited view of the process because they understood only their small part of it.
Process maps show the “bigger picture”. It is common with improvement projects that they are focused so closely to a small part of the process that – while they may improve that part – they do not improve the whole process very much. We need to have an understanding of the entire process so that our work improves the entire process and not just one small part of it.
Process maps are an excellent way to document what you are doing not only for the purpose of improvement but also for training, explaining the process to managers, and identifying key process steps required for such tasks as Sarbanes Oxley documentation.
How do I do it?
We urge people to draw process maps by hand on a large sheet of paper, flip chart, or “butcher paper” taped to the wall in the place the process is performed. The improvement team will draw the map themselves. Post-It® notes come in handy as the team creates the map. We use a five -step process to do this.
Step One: Assign an Improvement Team
This team will consist of 6-12 people. Most of the people will be subject experts; people who have intimate knowledge of the process. It is likely that no one will have detailed knowledge of the entire process, so it is important that the team has at least one expert from each area of the process flow. Other members will include “customers” of the process, an outsider who can view the process with fresh eyes, and lean specialists to facilitate the improvement. The process customers will often be internal customers rather than the end customer.
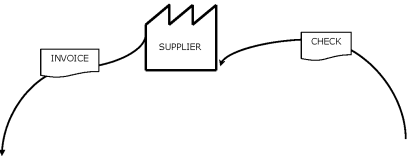
Step Two: Start with the Customer
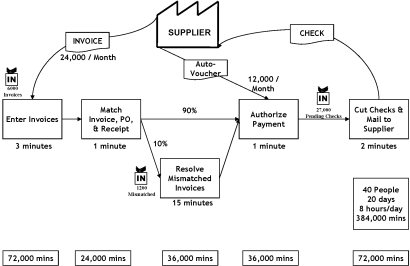
The starting point for mapping any process is the customer of the process. Identify the customer. Then identify what needs to be supplied to the customer by the process. Let’s take the accounts payable process as an example. This is the accounts payable process for a central shared service within a large multi-national corporation. This department provides accounts payable processing for many different divisions and locations of the company. On average the shared services team processes 36,000 invoice lines each month and sends out a check for each of these. Figure 1 shows that the “customer” of the process is the Supplier who needs to be paid. In this case the customer is also the primary supplier to the process; they supply the invoice that must be processed.
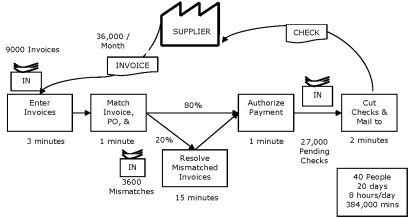
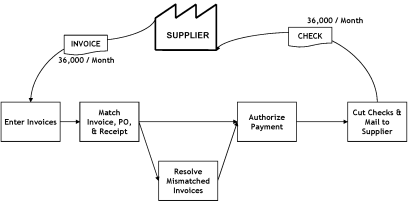
Step Three: Identify all the Tasks within the Process
Working from the customer backwards, “walk” through the entire process and show all of the tasks required to complete the process. It is important that you physically walk through the entire process so that the team can see the process, understand the entire process, gather process data, and measure the process. Figure 2 shows the resulting process flow.
Step Four: Gather the Data
All lean improvement is data driven. We must have valid and up-to-date data relating to the steps within the process we are seeking to improve. This data is best obtained by going to the place where the work is done and measuring or counting the key information required.
The Figure 3 shows data relating to the accounts payable process at our example company. The team has measured the cycle time for each task within the process, the rate of rejects in the matching process, and the number of documents that are in the queue at various places within the process. They have also measured the number of people in the department who complete these tasks.
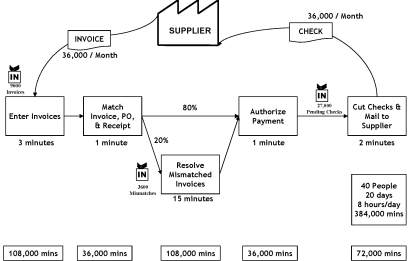
Step Five: Analyze the Data
The last step is to analyze the data within the process and understand the process performance. The Figure 4 shows the amount of time spent on each activity within the process and also the amount of capacity represented by the people in the department.
The next figure shows a box score displaying information about the performance of the process. Operational measurements are in the top section; financial measurements in the lower section; and information about the use of the capacity within the process in the middle.
| Current | Future 1 | Future 2 | Future 3 | Future 4
---|---|---|---|---|---
Flow Time | 22 | | | |
First Time Thru | 80% | | | |
Productivity | 900 | | | |
Productive | 66% | | | |
Non-Productive | 28% | | | |
Available Capacity | 6% | | | |
Employee | $270,000 | | | |
Other Costs | $100,000 | | | |
Total Costs | $370,000 | | | |
Cost / Receipt | 10.28 | | | |
Box score for current state
Explanation of the box score:
Operational Section:
Flow time: There are 39,600 documents in the queue within the process. The average number of documents completed each day is 1800 (36,000 in total in a 20 day month). The flow time is 39,600 / 1800 = 22 days
First Time Through: The number of invoices that flow through the process first time without additional manual validation is 80%. The other 20% go through the “resolve mismatches” task box.
Productivity: The process requires 40 people and processes 36,000 invoice lines per month. The productivity of the process is 900 items per person (36,000 / 40).
Financial Section:
This shows the total costs of the process. The 40 people cost $270,000 per month and other departmental expenses come to $100,000 making a total of $370,000 per month. The average cost per invoice is $10.28 ($370,000 / 36,000).
Capacity Section:
The team made the decision that they would designate the capacity used “productively” within the process as the tasks in the primary flow which are: Enter Invoices, Match Invoices, Authorize Payment, and Cut Checks. The “non productive” capacity usage is the task required to resolve the mismatches. The “available capacity” is the time left over after the other two categories are complete. Here is how they are calculated:
Productive (108,000 + 36,000 + 36,000 + 72,000) / Total Time (384,000) = 66%
Non-Productive 108,000 / 382,000 = 28% Available Capacity 100% - (66% + 28%) = 6%
With this completed, the team is now ready to move into kaizen – lean continuous improvement.
b. Kaizen – Lean Continuous Improvement
The word “kaizen” simply means “continuous improvement.” Continuous improvement is foundational to lean thinking and does not mean a series of projects to make the business better. It means that the organization develops a working culture whereby everyone in the company is engaged not only in performing their tasks but also in making daily improvement to the process.
To remove waste from the accounts payable process our example team recognized that this would require a series of improvement initiatives. These initiatives would include methods to improve the flow and remove waste from the process. They also recognized that the process itself is complete waste and that their efforts should focus on eliminating altogether the need for the process. This is common with accounting processes. The early stages of kaizen concentrate on removing waste from the process, but as the company’s lean thinking matures the emphasis will be on the removal of the process entirely.
We use a five-step process to do this.
Step One: Establish a Team
Our example team established a weekly meeting where they studied the process, reviewed the current performance of the process, developed actions to improve the process, and reviewed the impact of these changes. During the week the team-members worked on their improvement tasks. This demanded the team members free up some time from their primary responsibilities in the accounts payable department to work on improvement activities.
Step Two: Develop Performance Measurements
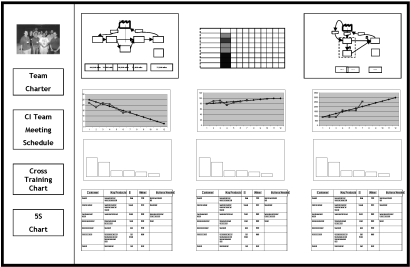
The team set up a performance measurement board for the process. The performance measurement board showed the three primary measurements (productivity, flow time, and first time through) and the current state value stream map.
Team members gathered this data every week and also created pareto charts showing the reasons for the problems within the process that caused lack of good performance. During their weekly meeting the team members worked to understand the root causes of these problems and established improvement tasks that were designed to improve outcomes by solving the root causes.
Figure 5 shows the Accounts payable improvement board. The board also shows the process maps, the detailed action plans for improvement tasks, and other relevant information.
Step Three: Develop Future State Process Maps
After they understood the root causes, the improvement team developed a future state map. The team created a vision for where they felt the accounts payable process should go over the longer term, but they quickly moved to practical changes they could accomplish in the short term. They then created a future state map showing the improvements they felt they could achieve over the next 3 months. Figure 6 shows the first future state map. The team also developed a detailed action plan showing how these changes would be achieved over the next 3 months.
Step Four: Implement the Future State
Achieving the first future state required converting some of the company’s suppliers to auto vouchering, which permitted them to eliminate invoices for these suppliers. It also required making some improvements in the way purchase orders were raised to prevent some of the mismatches. The results of these improvements are shown on the box score in Figure 7.
| Current | Future 1 | Future 2 | Future 3 | Future 4
---|---|---|---|---|---
Flow Time | 22 | 19 | | |
First Time Thru | 80% | 83.3% | | |
Productivity | 900 | 900 | | |
Productive | 66% | 53% | | |
Non-Productive | 28% | 9% | | |
Available Capacity | 6% | 38% | | |
Employee | $270,000 | $270,000 | | |
Other Costs | $100,000 | $100,000 | | |
Total Costs | $370,000 | $370,000 | | |
Cost / Receipt | 10.28 | 10.28 | | |
Figure 7. Box score for future state #1
You can see from the box score that there was considerable operational improvement from these changes. A good deal of the people’s time (available capacity) was freed up. The financial impact was zero because we still have the same number of people working in the process and the same operating costs.
Step Five: Repeat the Process
The team continued to meet weekly to review their progress and every three months they developed a new future state map and established action plans for the achievement of the new future state. Over a twelve month period the team made considerable improvement.
Here are some of the things they implemented:
a. They worked with the company’s various purchasing (or supply chain) people to certify more and more suppliers for self-billing.
b. They created cells where the people in the department worked together in teams of 4 to perform the accounts payable process.
c. The work within the cells was balanced and leveled so that the cells became a great deal more productive than when the people worked individually.
d. These productivity improvements enabled the team to reduce the number of people required within the process. After 9 months they were able to free up 18 people and by the end of the first year of work they free up a further 8 people.
e. The people freed up were moved to other positions within the organization. Some became value stream accountants working within the company’s value stream to assist the value stream managers in cost reduction and reporting. Other moved into marketing and product development value streams working to better understand value creation for the customers and to build this into the company’s products and services through the use of target costing. Others moved into various corporate responsibilities and lean improvement positions.
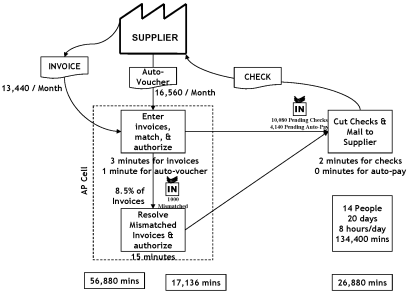
The process map at the end of the first 12 months of improvement is shown in Figure 8. The resulting box score is shown in Figure 9.
| Current | Future 1 | Future 2 | Future 3 | Future 4
---|---|---|---|---|---
Flow Time | 22 | 19 | 12.3 | 12.3 | 10.2
First Time Thru | 80% | 83.3% | 93.3% | 93.3% | 96.8%
Productivity | 900 | 900 | 900 | 1636 | 2571
Productive | 66% | 53% | 34% | 63% | 62%
Non-Productive | 28% | 9% | 9% | 17% | 13%
Available Capacity | 6% | 38% | 57% | 20% | 25%
Employee | $270,000 | $270,000 | $270,000 | $148,500 | $94,500
Other Costs | $100,000 | $100,000 | $80,000 | $70,000 | $65,000
Total Costs | $370,000 | $370,000 | $350,000 | $218,500 | $160,000
Cost / Receipt | $10.28 | $10.28 | $9.72 | $6.07 | $4.44
Figure 9. Box score for future state #4
In summary: there were no “silver bullets” that enabled the team to achieve these results. The improvement tasks include a wide range of initiatives to improve the flow, eliminate waste, address root cause problems in the operations processes, purchasing processes, administrative processes, as well as the accounts payable process itself.
The team continued to meet each week and continued to develop new process maps to drive further improvement, eliminate waste, and save cost. This work has been very satisfying to the team members. Prior to the company adopting lean thinking, these employees had never had any opportunity to take responsibility for improving their own processes. The department had operated for many years using the costly and wasteful methods of traditional management.
When you empower people and develop a culture of continuous improvement great things happen. The improvement of this accounts payable process was not a “project” – it was and is an on-going culture of continuous improvement.
c. PDCA – Problem Solving
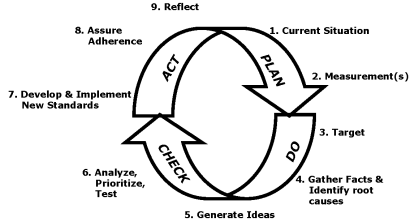
Lean continuous improvement is not done randomly; it is performed using formal problem solving methods. These methods are encapsulated within the Plan-Do-Check-Act (PDCA) system made famous by Dr. Edwards Deming in the 1980’s. PDCA is often called the Shewart Circle, shown below (Figure 10) and named for Dr. Deming’s mentor Dr. Shewart.
The PDCA problem solving method provides a disciplined framework for problem solving leading to:
a. The solution of root causes rather than surface issues;
b. The application of the “scientific method” whereby improvement ideas are measured and results verified;
c. Demonstrated improvements are standardized and sustained;
d. Initial improvements lead to further improvement;
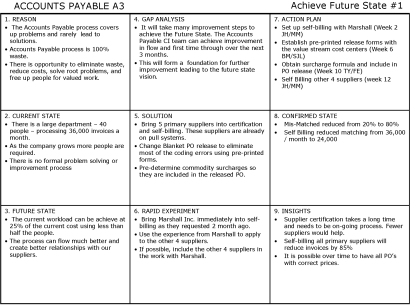
It is very important that lean continuous improvement is performed using these formal problem solving methods. Many companies have adopted the so-called A3 method developed within Toyota Motor Co. The entire problem is documented on a single sheet of large (A3 sized) paper containing a section for all the steps within the PDCA process. The format of these A3’s varies considerably from one company to another. Figure 11 shows an example of A3 from the accounts payable processes discussed above.
Process maps can also be used for documenting Sarbanes Oxley and ISO requirements and standard work. Most companies have created SOX documentation by writing large manuals and imposing standards on the process departments. Lean organizations have fulfilled SOX by drawing process maps, color coding the SOX risks, documenting the risk mitigations, and training the people using the maps and standardized work. This SOX documentation is often done during a lean improvement within the process. This way the documentation is a part of the overall improvement of the process. This approach leads to support from the process owners or value stream managers.
There are many formats and methods for process mapping. It does not really matter which method you use. But make sure the diagram is easy to read and understand. Make sure you can “see” the flow. Make sure the required data is available and given on the map.
The book was a collaboration by BMA's team of experts, including Brian Maskell, Bruce Baggaley, Nick Katko, and David Paino. Much of the book is based on their hands-on experiences with BMA clients.
You can order this book from the BMA Inc. The Lean Accounting Leaders web site. Here's that link: http://www.maskell.com/Books.htm
The friends and colleagues comprising the Lean Accounting Learning Leaders group at the Dearborn summit include: Orry Fiume, Jean Cunningham, Jim Huntzinger, Norman Bodek, Robin Cooper, Fred Garbinski, Jerry Solomon, Mark Deluzio, Bill Waddell, Bob Emiliani, David Cochran, Doc Hall, Jamie Flinchbaugh, John Coomes, Larry Grasso, Michael Bremer, Bruce Baggaley, and Brian Maskell.