This article is from the Superfactory Archives, an archive of content from the Superfactory website that existed from 1997 to 2012.
Lean manufacturing is first and foremost a gritty, hands-on factory issue. This is written by a factory guy for other factory people. If you are an executive, a headquarters staff person – for that matter, if you have an MBA or work in accounting at any level – you might just as well skip this article. There is nothing here of ‘strategic’ value at the ‘enterprise’ level. That is not to suggest that Value Stream Mapping and lean thinking at the broad strokes level has no value. It certainly does, but eventually lean has to come to life on the factory floor and this article is intended to address that point, where lean theory becomes lean reality.
Factory people know that lean is primarily about cutting cycle times on factory floors, reducing inventories and floor space, cutting costs and improving quality. Theories and books do not get much attention on the shop floor. The plant is a world of harsh reality where specific, tangible, practical actions take place. The people there spend little time talking about what they are thinking and less time telling other people on the floor what to think. Factory people talk about what they and others should do. Factory people do not need theory; they need Shigeo Shingo.
Shingo was the industrial engineering genius behind the Toyota Production System, and he was not much for theory either. His books give the philosophy of lean pretty short shrift and he recommends that you read Taichi Ohno – the head of Toyota Manufacturing – or just about anyone else if you want theory. He was a nuts and bolts sort of a guy who wrote and talked about machines and containers and the things on the factory floor you can get your hands on.
He did say, however, “We have to grasp not only the Know-How but also ‘Know Why’”, if we want to master the Toyota Production System (TPS). By that he meant that it was not enough to simply know what the tools of TPS are and how to apply them, it was necessary to know when and why to use them. The tools are those things such as kanban, one piece flow, Single Minute Exchange of Dies (SMED), and so forth. Those are the tools to be used to attain the goal of TPS: cycle time reduction.
Look at it as though you were a carpenter. Knowing how to use hammers and saws is important, but only if you know how to build a house with them. Without a logical blueprint or a plan, you are just beating up wood. The blueprint is not theory. It is very specific. The theory of houses is the domain of architects and structural engineers. The blueprint is the set of instructions that tell the carpenter step by step how to use the tools to make the theory into reality.
The “Know Why” Shingo wrote about was the need for a blueprint for your specific factory. The consultants and corporate folks who give you another book on lean manufacturing theory, then cannot understand why you show a distinct lack of enthusiasm, don’t understand. They are giving another photograph of a beautiful home to a person who has seen enough photographs, but is desperately in need of a blueprint. My aim in this article is to provide you with that blueprint – a clear, logical and simple way to know what tool to use and when, in order to realize the theoretical benefits of lean manufacturing.
There’s an old saying, when the only tool you have is a hammer, all of your problems look like nails. As a materials manager, my lean tool was kanban or pull systems. My reaction to lean was to gut the MRP systems and rush out into the plant and pull, or kanban, everything. Of course, pull is always better than push, but there were many times when it did not accomplish very much. Consider, for example, a capital equipment manufacturer that sold a handful of machines per month. Each machine sold for a million dollars or so and had a bill of material of thousands of unique parts. The factory moved at the pace of molasses as these behemoths came together. Frankly, it did not matter too much whether the parts were pulled or pushed to the jobs.
In another company, the real problem was that machine set up times drove huge production lot sizes. With sales of about a hundred each day, and production lot sizes of a thousand or more, parts moved through the plant like a pig being swallowed by a cobra. I suppose it was better to pull the pig through than to push him but, either way, it was an ugly sight!
I have worked with people whose background is manufacturing engineering who had similar experiences. They saw set up reduction as the cure for every non-lean situation. In other plants, good quality folks saw SPC and poka yoke as the cure all. They encountered the same disappointment. Certainly any improvement in set up times or quality is good, but it is of small value if it was not the primary problem.
Another difficulty is a lack of necessary follow through. More than one mechanical engineer or quality specialist has launched an improvement effort in the interest of lean manufacturing, and then walked away assuming that somehow the change they made automatically translates into a cycle time reduction. It doesn’t work that way, at least in any of the companies I have seen. The improved situation has to be translated into lower lot sizes, different handling procedures, and embedded in the scheduling system before flow actually changes.
Shigeo Shingo understood the problems resulting from deploying the tools of the Toyota Production System without a plan, and the primary purpose of this article is to provide factory managers with that tool. Before using the Shingo’s tool, however, it is necessary to put together a basic process flow chart.
If Microsoft Visio is your thing, or you are actually an artist trapped in a manufacturers’ body, fell free to make the flow chart as pretty as you want to, however, there is no extra credit given for anything over and above a barely readable level. All that is necessary is a sequential series of boxes, or other shapes that indicate what the step is and whether it is a value adding / production step (a machine or an assembly for the most part) or if it is non-value adding (inspection, storage, move, wait, etc…) It is important that you chart the process from start to finish.
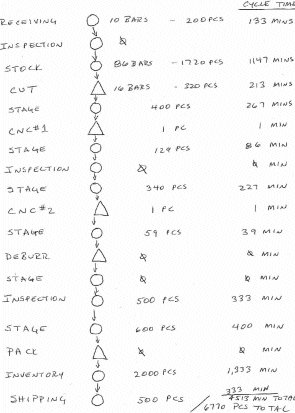
The start is always the point at which the basic raw or purchased material first comes in the door at the plant receiving dock. The end is when the product leaves the plant, or if you are charting a sub-assembly or component flow, when the process ends at the higher level assembly process.
The essential element here is to be sure to identify every move the part makes from receipt to finish. How you represent it on the flow chart is not important, as long as each step is clearly identified and denoted whether it is value adding or not. It is also important that you develop the chart by personally walking the flow. Do not rely on a router or someone’s idea about how the process is supposed to flow. Be sure you have charted how it really flows. The form of the finished flow chart has no bearing on the success of your lean manufacturing effort. The accuracy of it has everything to do with your success or failure.
Along the way, in addition to charting the flow, count parts. Cycle time is just another word for inventory. Feel free to use the two words interchangeably. It stands to reason that, if you receive and ship one of something a day and you have ten of them in process (WIP inventory) or sitting in a raw or purchased stage (Raw Materials and Purchased inventory) or in finished goods, then the cycle time is ten days. At a rate of one per day, the one received today will ship in ten days. To calculate the cycle time, you need to know how many parts are at each step.
This part can be a little tricky, depending on the sort of manufacturing you are doing. Quite often you will have to do a little math to convert raw and in process materials to their equivalent in finished goods. If, for example, you are converting resins into injection molded products, you will need to determine how much resin is required per finished part and divide the resin inventory by that amount to calculate the cycle time. The same is true with stamped steel or cast metals. There may also be cases where two of something are assembled to make one finished product. In such situations, the purchased inventory must be divided by two. If you understand the concept and apply common sense and a little math to the inventory you count along the way, I am sure you will arrive at the right figures.
Next, as you walk the process and draw your flow chart, counting parts along the way, ask the operators if what you are seeing is normal. Perhaps you are coming by at a time when someone has left an extra tub or skid of parts there for an unusual reason and the normal condition is to have far less inventory. Or perhaps the opposite is true. The skid that is almost always there was just moved. Try to get a handle on the normal state and adjust the numbers according to your best judgment.
Note that calculating cycle times is not an exact science. It is quite a bit like trying to calculate the amount of water in a certain section of a river. Long before you have completed the math, the answer has changed. In the same way, the factory flow is always fluctuating. The idea is to get the best sense of the normal state at each step in the process.
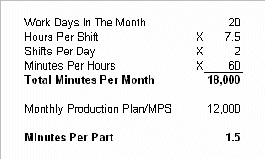
Converting inventory to time is pretty straightforward. The following table shows a basic example. Determine the number of minutes the plant will operate over the course of a week or a month. Then divide this by the number of products planned for the same period. In this case, it indicates that the plant needs to produce one finished product every 1.5 minutes to meet demand.
The in process inventory numbers at each step are then divided by the minutes per part to determine cycle time. If, for example, there is a skid of 600 parts sitting at a quality inspection point, the 600/1.5 = 400 minutes of cycle time. Once the overall process cycle time and the cycle time at each step have been calculated, it is time to use Shingo’s ‘Why’ tool.
As the figure below indicates, the tool is a simple flow chart or decision tree that takes you from a block of non-value added cycle time at the far left to the correct tool to deploy in the column along the far right. The Japanese have long said that you must ask “Why” five times to get to the root of any issue. The chart shows that answering five basic ‘why’ questions will get you to a solution.
The first question is whether an inventory of parts or material, or cycle time (remember they are the same thing), is there because of a machine lot size decision, or because of the manner in which material flows through the process.
If the answer is machine lot sizing, no further analysis is necessary – go directly to set up reduction. Then reduce the lot size accordingly.
In reducing set ups, the first order of business should be to get a watch and go out and time the set up for yourself. Far too often, the set up time was originated with a ‘seat of the pants’ guess by a maintenance person years ago when the MRP system first went in. That guess was padded, given to his boss, who doubled it in case someone planned to use it to measure him, then was entered into the system where it has resided unchanged ever since. The excessive lot size is apt to be, in part, the product of an analyst applying highly sophisticated EOQ algorithms to that hopelessly fudged set up time. It is surprising how often lot sizes and cycle times can be drastically improved simply by getting accurate data.
If it is not a machine lot sizing issue, then further digging is necessary. You must ask whether it is the product of physical considerations in the factory (the size of a WIP container, for example, or is it due to problems (real or potential). In some cases, no matter how deep you delve into it, the answer is that no one knows why the parts are there is big numbers – it is simply the way its always been done.
Let’s follow the path of physical considerations. These can be broken down into material handling issues or an unbalanced capacity or flow situation. The material handling problems are either a function of the containers used or the distance between one operation and the next. Material handling inventory is typically quite easy to fix.
In one case, I worked in a plant that machined small parts and put each one into the cavity of what looked like an egg carton with slots for 30 eggs. Even though the next machine was only a few feet away, no parts moved until a carton with 30 pieces was filled. The rationale was that the 30 piece container was an excellent package for storing and shipping finished products. That may well have been the case, but using them from the beginning of the process, going through a half dozen or so steps, meant that almost 200 parts were in process unnecessarily. This was an easy problem to fix and a significant reduction in inventory or cycle time was achieved. In another plant, in process parts were moved in skids of hundreds of parts from one operation to the next no more than 25 feet away. Again, speeding the cycle time through smaller lot material handling was easy to achieve with virtually no additional cost.
In many cases, however, the large lots of in process parts are the result of the factory layout. The distance from one operation to the next is so great that, if the parts were not gathered into forklift size containers, someone would have a full time job running back and forth carrying parts. In this situation, pursuing a cell layout, with the machines in close proximity to each other is necessary.
It is important to note that, in the case of automated or semi-automated machines, it often make sense to arrange machines in cells to allow one operator to run more than one machine. This may be beneficial in many cases, but it is not necessarily lean manufacturing. It is important to realize that such cells are often created to the detriment of cycle time. Creating manufacturing cells without a keen focus on cycle time is a dangerous practice, no matter what the direct labor savings might be.
There will be cases in which rearranging the plant is simply not feasible. Such cases may include processes that include ovens, painting or other finishing operations, and so forth, where a massive central operation supports a variety of processes. In other instances, the bricks and mortar are simply too expensive to rearrange. While it may be something you just have to live with (Lyndon Johnson once said, “Sometimes you just have to hunker down and take it like a jackass in a hail storm”), this is no reason to let the rest of the plant be less lean than it can be. Just work around it and move on.
An unbalanced capacity situation presents a situation in which kanbans present the greatest payoff. Machine A puts out 20 pieces per hour, feeding machine B, which processes 5 pieces per hour. Do not produce 20 pieces on A, and then let them sit in front of B until it can chew through them. Instead, a simple two bin pull system, using two containers of 5 will cut cycle time in half. The purpose here is not to describe in detail how to create and implement the kanban – or how to deploy any other of the TPS tools – there are ample better sources for that if you are not already familiar with them. Rather, it is to reinforce the idea that deploying the right tool in the right circumstance leads to the greatest improvement.
The next block of options are those to pursue if your investigation leads to the conclusion that the in process inventory is there as protection against problems. Quality and machine reliability are the two biggest problems factories buffer. They require quality and reliability solutions, of course. It is interesting to note, however, that very often the quality problem is not product quality per se. Instead, it is a function of the quality assurance process.
For example, I once deployed this tool in a plant that had a full skid of valve cover plates – a shift’s production – that accumulated and sat for a random mass spectrometer test. The reason for the delay was not the test, itself. There were trained people in the lab available at any time. Rather, it was for the quality supervisor to come by and select the plates “at random” to be tested. This was a policy that predated plant management and had been carried out unquestioned for years. While it required a trained person to perform the test, a chimpanzee could have easily been trained to pull a couple of parts out of the box to test. The policy was changed. The operators selected a couple of parts, sent them to the lab, and the practice of holding a shift’s production stopped.
The last, and perhaps most interesting, tool to discuss is the Bank Method, which is used if the root source of the inventory is unknown. There are many cases in many plants in which extra parts are kept at some point in the process “just in case”. Just in case of what is undefined, or unreasonable. You may hear stories of how the plant caught on fire back in 1964 and “what if that happens again”. It usually is as simple as someone – maybe even the plant manager – gets very uncomfortable if the parts are not there.
We cannot solve a problem we cannot define. Interesting enough, Shingo encountered this same situation at Toyota. Apparently, the Japanese did not have an easier cultural acceptance of zero inventories than we do. The Bank Method is a simple way of turning this fear into something specific.
In order to deploy the bank method, you simply sit down with the worried parties and solicit their agreement that the inventory will stay, but it will be somewhere secure and only you can release it. In the event that someone comes to you in need of the parts, you can then delve into why they need them and have a defined problem to solve. You would all agree that if no one needs the parts in X months, however, the inventory will be eliminated.
Please do not misconstrue this article to imply that any of the TPS tools are unimportant. Every plant needs all of them to some degree. The primary message I am trying to send is that cycle time reduction efforts will generate almost immediate results if you use Shingo’s Why logic to deploy the right tool to the biggest problem first. The method and logic are simple. Every plant can have multiple improvement efforts in multiple processes going on simultaneously that all make sense.
Equally important is that the logic necessitates identifying a specific block of cycle time – which means a specific pile of inventory before deploying the tool. We are going to reduce set up time or implement a kanban or whatever in order to eliminate that inventory. It is not a theoretical process improvement. It is very real and very physical – a hands-on approach to driving the Toyota Production System in your plant.