By Michael Bremer
This article is from the Superfactory Archives, an archive of content from the Superfactory website that existed from 1997 to 2012.
Look at performance improvement initiatives implemented around the world over the last twenty years like TQM, Cost of Quality, Time Based Management, Supply Chain Management, etc. and listen to the noise level inside organization. The two most popular business performance improvement methodologies today are Lean Enterprise/ Manufacturing and Six Sigma. Unless something different gets done with these powerful methodologies are they destined to follow the same path as their predecessors, in the world of business performance improvement methodologies?
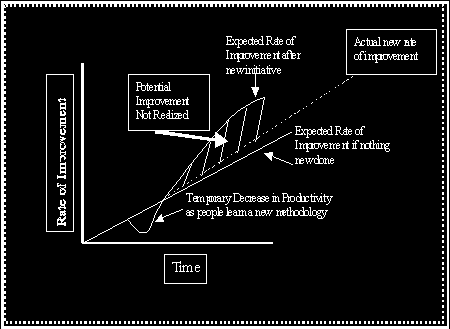
Surprisingly, organizations do actually benefit from implementing these improvement programs. But the actual results fall so far short of the expectations of the leadership team, project team members and the individuals guiding the improvement activities, that they were rated as failures over 70% of the time in studies done by McKinsey, Bain and others. See Exhibit 1 below.
So why do powerful business improvement methodologies fall so far short of expectations? What are the Missing Links?
Missing Link Number 1 – Strategic vs. Improvement Projects
Many more improvement project opportunities exist inside an organization than strategic projects. So there is a tendency to deploy improvement resources on something other than strategic endeavors. From a leadership perspective this is a killer. The leadership ultimately loses interest in the improvement activities, because their attention is appropriately elsewhere. The “Rule of 3” should be used to determine critical strategic priorities and if the improvement methodologies are appropriate, they should be used on these initiatives. Here is a typical example. A Wisconsin manufacturing company had launched both Six Sigma and Lean Enterprise improvement initiatives.
They had 50 projects underway. The leadership team attended a one-day champion’s training where the question was asked, “How many of the improvement projects underway were discussed at their recent strategic planning retreat?” The answer was none. They had spent their time talking about three issues critical to the future of the business: a start up in China, new environmental regulations coming out of Europe and a planned new product. When asked if these issues were more important than most of the 50 projects, their response was, “Yes!” They ended up redeploying their resources as a result of that conversation.
This shift had several major benefits. They had the new China venture up and running 50% faster than their original plan. They also learned about the improvement methodologies the company was using as a result of managing the “strategic” project in China. This learning carried over to the other improvement projects underway in the organization. It upgraded the “improvement process.”
Missing Link Number 2 – No Clear definition of “savings”
Improvement efforts lose credibility when they report savings, but the P&L does not change. Several savings categories exist. Future Revenues; Hard Dollars; Soft Dollars and Cost Avoidance.
-
Future Revenues – these savings are directly traceable to the bottom line. They come from margin growth or increased volumes from specific sources – existing customers, existing products or new products, new customers and revenue acceleration. These savings are forward looking opportunity dollars.
-
Hard Dollar Savings – demonstrate a clear and direct impact by quarter (traceable) of changes in the financial results. They come from a net reduction in resources used: materials, people, outside contractors, transportation cost, elimination of defects, lower cost of quality, etc. These savings are typically backward looking, doing it at a lower future cost.
-
Soft Savings – come from projects that are not directly traceable to the bottom line, but that over time should yield a business benefit. Lean savings typically come from faster cycle times, capacity improvements (where the increased outputs cannot immediately be sold, faster transaction processing, reductions in rework (without a reduction in inputs), improvements to a process that is not the bottleneck operation, etc. It’s important for leadership teams to be aware of “soft dollar” savings. They will most likely require actions from leadership if they are ever to be converted into “hard dollar” savings.
-
Cost Avoidance – These savings are tough to quantify. For example: if the organization develops a series of improvements that permit it to avoid a major capital expenditure it may have an avoidance savings, but they are costs never actually incurred. Prevention investments to avoid safety problems, disaster recovery systems, governmental compliance initiatives, etc. all fall into this category. These are costs that were never actually incurred. Hopefully the investments prevent future problems from happening. People get emotional about cost avoidance. While they may be important actions for a business to take; they should not be commingled with project savings.
When these four saving types get commingled together and reported under ‘one’ all encompassing savings column, it undermines the effectiveness of the word ‘savings’ because many of the dollars will have no immediate impact on an organization’s P&L.
Missing Link Number 3 – Wrong Metrics Get Used
Metrics present a problem for many companies. They often cause more harm than good. Organizations have too many, yet they still do not have the right ones. Metrics also are often used as a weapon, which then drives fear and dysfunctional behaviors. Organizations need to focus on process metrics (leading indicators) that will guide people toward desired results. 50% of metrics should change every 18 to 36 months as business conditions and the business environment evolve.
Consider the following story and if you do not understand the sport baseball don’t worry about it. All you need to know is this is a 100 year old industry, driven by performance metrics. There is a pitcher throwing a ball and a batter trying to hit it. Simply speaking, points (or runs) get scored by the batter getting on base.
Several years ago someone interested in statistics and in baseball looked at the metrics typically used by baseball teams. He was trying to predict the number of wins a team would experience during the course of a season based on baseball’s traditional metrics. But he could not find any statistics in use that would let him accurately predict the number of wins a team would have.
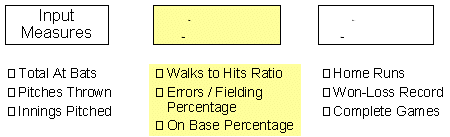
So he began pulling together his own data and arrived at the following conclusion. The number of wins a team would achieve during the course of a season had a direct relationship to a few key “process metrics”: on base %; errors vs. fielding opportunities and walks vs. hits ratio.
I personally find this baseball metaphor powerful. Here you have this 100 year old industry with very visible, daily performance results. Yet they were not using the right metrics - those which can predict the number of "wins" a team would experience over the course of a season. If they don't have it right in this visible industry, with obvious wins and losses - what does that say about the rest of us? To me, it says we have major opportunities to improve our identification and use of metrics. The above story is told in “ Moneyball ” by Michael Lewis.
Another point to consider about metrics is how often do they change? In a healthy system things change. Yet most business performance measures have not changed for decades! How could they possibly focus on important issues for today’s business environment, it they have not substantially changed for 20 years? Metrics should relate to key improvement opportunities and important fundamentals. The fundamentals may not change much over time (on-time; quality; complete, etc.). But improvement needs do change (new strategies; cycle times; competitive targets; etc.) So in a healthy system 50% of the metrics may change every 18 to 24 months.
Leadership Governance
So what does this mean? Leadership teams lose interest, largely because the above actions are not taken. Two to three years after implementation these business process improvement methodologies are typically no longer focused issues critically important to the leadership team.
This issue gets resolved through Governance done in an effective fashion. Project team sponsors and leadership teams have specific Roles, & Accountabilities for project teams. They need to understand their R&R and execute them. If you have questions about this I would be happy to share more information if you contact me. The brevity of this article simply does not permit space to list these R&R here. Leaders who take action to address the above issues begin to think more deeply about their organization. This deeper thought is much needed!