By Bob Emiliani
This article is from the Superfactory Archives, an archive of content from the Superfactory website that existed from 1997 to 2012.
Unaware of the details of Toyota’s history, it’s easy to think that Toyota managers and workers were the originators of all the important ideas. In fact, they were the originators of some important ideas and adopters of ideas from many others†– most good, but a few not so good. This article highlights one idea that originated in the U.K. and which Toyota senior managers have for decades found very useful for determining the size and output of their automobile plants, and for informing them when to develop new models.
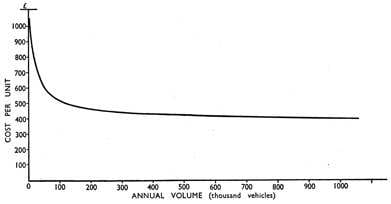
For many years I have been interested in the origins and evolution of Lean management and have recently written book chapters and papers on the topic [1-4]. During the course of my studies I have periodically come across reference made by Toyota executives and others to the Maxcy-Silberston production cost curve, invariably without attribution or with erroneous attribution. As a result, the original source for the curve had long been difficult to locate. The curve appeared in the 1959 book The Motor Industry, a landmark study of the British automotive industry from the early 1900s to 1957, written by economists George Maxcy and Aubrey Silberston [5]. Importantly, the book also included a description of how the cost curve was derived [6], which I will discuss later. Figure 1 shows the elusive Maxcy-Silberston cost curve (also known as an “experience curve”).
This curve describes a quasi-empirical relationship between the total cost per unit and annual production volume for a hypothetical “unit” consisting of a mix of different models of mass-market cars, vans, and trucks, “with varying degrees of interchangeability between them,” in the U.K. in the early- to mid-1950s (a high growth period). The shape of the curve suggests there is little in the way of economies of scale beyond a cumulative output of about 200,000 to 250,000 units per year.
Since the late 1950s, Toyota senior executives have viewed this cost curve as helpful in guiding their thinking and decision-making with respect to the size and output of new automobile plants [7]. Taiichi Ohno accepted the Maxcy-Silberston cost curve for about 15 years during Toyota’s high-growth (sellers’ market) period, from about 1958 to 1973. The Maxcy-Silberston cost curve loses relevance in slow growth (buyers’ market) periods, such as what Toyota started to experience after the 1973 oil shock, according to Ohno [8]. While Ohno thought that Toyota’s Production System invalidated or greatly undercut economy of scale effects and the Maxcy-Silberston cost curve, the Maxcy-Silberston curve seems to be relevant even today to Toyota senior management’s thinking in terms of annual factory production output. The question is, why?
In 1994 when I was a manufacturing manager at Pratt & Whitney, I can vividly recall our kaizens and the hundreds of wonderful improvements that we made to our products and processes. We were achieving for the first time quick set-ups, short or no queue times, tremendous reductions in part travel, improvements in quality, etc. These kaizens, many of which were facilitated by sensei Doi Yoshihisa, then of Shingijutsu Co., Ltd., were practical and helped our business unit tremendously. I can also vividly recall meeting with finance executives each month who would project onto the screen an cost curve of an earlier product, onto which was superimposed an anticipated cost curve for the new product we were working on. I was struck by the enormous disconnect in how operations people went about reducing cost, through fundamental process improvement, compared to how finance managers viewed cost reduction, theoretically through economies of scale and cost curves. Their task, unlike Mr. Doi’s task, was to drive us to hit points on a simplistic, arbitrarily-determined cost curve. The dissonance was jarring and unforgettable.
In 1999 sensei Doi came to Hartford, Connecticut, from Yokohama, Japan, to facilitate kaizens at local first-tier aerospace suppliers. Production cost curves were still on my mind five years later, and so I asked him at dinner one night what he thought of the relationship between cost and production volume. I asked Mr. Doi this question in part because it was conspicuously absent from the early Lean production and Lean accounting literature [9] and I thought he might know why. Almost before I could finish asking the question, sensei sternly admonished me – actually rapping me on the head with his knuckles – telling me that it was not the right way to think. Instead, Mr. Doi said people must think this way: If a manufacturer expects to meet customers’ expectations with respect to prices in competitive markets, then costs must decline as a function of time, not volume, by improving designs and processes from beginning to end. He drew a sketch on the placemat to explain what he meant and it made perfect sense, but I still had questions.
For many years I had viewed the type of cost-volume relationship expressed in the Maxcy-Silberston curve as fundamentally flawed because it promotes overproduction (under any market condition). However, I remained curious as to why this relationship was conspicuously absent from the Lean literature written by Japanese authors in the 1980s and 1990s – it was not even directly refuted until the onset of the post 1973 slow-growth period cited by Ohno [8]. It was as if the cost-volume relationship was so obviously a stupid way to think that it was not even worth mentioning in any of the most important books. Yet it shaped the thinking of Toyota executives for decades, and apparently successfully so. Again, the question is why?
The Maxcy-Silberston production cost curve keeps popping up, most recently in the 2006 book, Inside the Mind of Toyota, by Satoshi Hino [10], and in Masaaki Sato’s 2008 book The Toyota Leaders [11]. Hino says that the Maxcy-Silberston cost curve is still relevant to Toyota management after almost 50 years. He says that the value of the curve to Toyota senior managers is different. To most executives, the cost curve says they should seek to increase the annual production volume of a factory from 200,000 to 1,000,000 units to maximize economies of scale and achieve the lowest possible production costs. To Toyota mangers, the curve suggested something different: that “…it would be more profitable to increase overall sales by developing new models…” [12].
From Toyota’s viewpoint, producing more than 250,000 vehicles was ill-advised because there was little additional cost savings to be had from economy of scale effects. So instead of focusing on securing the last drop of cost savings, they should determine what other products customers want and manufacture new models that satisfy those needs. This unique view of the Maxcy-Silberston cost curve helped Toyota become a full-line automaker and grow to become an industry leader.
The cost curve was originally created by Maxcy and Silberston to provide guidance to British auto industry executives, which at that time consisted of five major companies: British Motor Corporation, Ford, Rootes, Standard, and Vauxhall. Its purpose was to give the executives an estimate of the expected reductions in cost per unit that could be achieved if annual production volumes were increased. This information provided an indication of the future growth potential at the level of the firm and of the industry as a whole.
In the late 1940s through the mid-1950s, each British motor company produced 50,000 to 200,000 vehicles per year, where the volume of popular models ranged from 50,000 to 100,000 per year. The Maxcy-Silberston automobile production cost curve showed that doubling or tripling production volume would yield large cost savings. The British motor industry thus had considerable room for growth, according to the economists, as sales would surely grow as costs and prices fell.
The economists were telling British auto executives that growth, and therefore future success (and survival), is best achieved by becoming more supply-driven; to overproduce. That is, they should become more aggressively supply-driven (e.g. 30% supply-driven, 70% demand-driven) where a larger supply of vehicles at lower prices will create greater demand, versus relying on customer demand for vehicles at current prices to create the necessary supply (e.g. 10% supply-driven, 90% demand-driven) – which is what the British motor industry had largely done for much of its early existence. Expanding the supply of existing vehicles and creating new vehicles, however, consumes financial and other resources necessary for improving auto parts, creating new automotive technologies, and updating established products to help ensure long-term survival. So there is risk in being supply-driven, and it is not solely related to the cost of new products and expanded inventories.
The Maxcy-Silberston cost curve graphically supports the argument for automakers to focus more on economies of scale and become more supply-driven. However, the data used to generate the curve was based on two flimsy pieces of information: “the small amount of available [published] quantitative evidence” and estimates from one major U.K. automobile company “based solely on an opinion” [13]. That major U.K. automobile company from which the opinion came was probably British Motor Corporation Ltd., formed in a 1952 merger of Morris Motors Ltd. and Austin Motor Company, Ltd.
It is astonishing that Toyota executives would put so much faith in the Maxcy-Silberston cost curve given: 1) how it was derived; 2) the fact that it was a rough estimate, a simple model used to describe complex inter-connected relationships; and 3) that it was rooted in batch-and-queue processing and standard cost accounting [14]. Note how the neatly drawn continuous line in Figure 1 deceptively suggests rigorous research and precise data [15].
The Maxcy-Silberston cost curve informed Toyota executives on many decisions, each costing hundreds of millions of dollars. Apparently Toyota’s own cost accounting data post-1965 validated the Maxcy-Silberston cost curve sufficiently well to warrant its continued use even as growth slowed after 1973. In addition, Toyota’s unique interpretation of the curve has apparently served it well for several decades [16] compared to competitors who unwisely sought to produce larger and larger volumes as the principal means to reduce costs. This expansion of volume and associated investments proved to be a mistake once consumer markets began to diversify, competition increased, and growth slowed.
While in Ohno’s view the Toyota Production System eliminates the need for scale [8], other Toyota senior executives, one after another, apparently saw a need for scale to drive down costs [17]. However, the flaw that is built into the Maxcy-Silberston cost curve is that it compels company executives to authorize producing too many of one product, to produce too many different products, or to do both, resulting in gluts of supply, especially in contracting markets. Management commitment to the Maxcy-Silberston cost curve eventually leads to a systemic breakdown of discipline needed to fulfill actual customer demand at the required price [18]. It seems that however the Maxcy-Silberston cost curve is interpreted, it will outlive its usefulness sooner or later and cause a lot of trouble. Therefore, it is not a valid model for executive decision-making, even if the data were rigorous and precise [14, 19]. Toyota finally fell victim to the Maxcy-Silberston cost curve in 2008, having experienced less severe problems with it in the late 1980s and early 1990s [20].
So what now? It would not make sense for Toyota to continue to pursue a dubious representation of economies of scale (Figure 1), even when economic conditions improve, because it will only lead to a repetition of errors. What Toyota (and others) can do is de-emphasize economies of scale thinking and totally eliminate the use of production cost curves. A return to its long-standing policy of stable long-term growth (3-5% per year), from which it deviated between 1998-2008, would be helpful, as would supplying to actual customer demand. The way to do that is to focus on achieving flow [21] as Frank Woollard did in the 1920s [4] and Taiichi Ohno [8] did in 1970s. (Note that achieving flow in sellers’ markets improves gross profit margins, so the rationale for pursuing flow transcends any specific market condition).
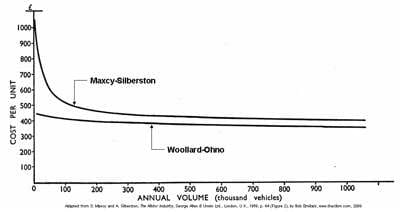
Figure 2 shows why achieving flow is so important: it removes the deep bend at the start of the Maxcy-Silberston cost curve [14]. The decline in cost in the Woollard-Ohno curve is due to a huge reduction in time – principally set-up time, queue time, and transportation time – not an increase in volume. The positive impact on both profitability and competitiveness is obvious.
The Woollard-Ohno production cost curve is a “flow cost curve,” while the Maxcy-Silberston cost curve is better characterized as a “scale cost curve” [22]. Flow is what manufacturers (and service providers) should strive to achieve through disciplined market feedback and analysis, design to target costs, production preparation, production, and production improvement activities, inclusive of the thorough elimination of waste, unevenness, and unreasonableness.
The Woollard-Ohno flow cost curve suggests to executives that overproduction of popular models to achieve cost savings is not worth pursuing. That is a significant improvement over the Maxcy-Silberston scale cost curve. However, it could still suggest to senior managers that they authorize production of many different products. One must be on guard for this possible interpretation [23], because it will surely lead to higher costs though excessive product line differentiation – such as Toyota building numerous models of low mileage vehicles for the North American market.
This article highlights just one example of how Toyota senior managers were influenced by non-U.S. automakers. My research shows that Ford Motor Company was one of many automakers that influenced Toyota, and it may not have even been the most significant overall. Toyota was influenced in many different and more positive ways by British [4] and continental European automakers [24] (not economists), whose customers were more like Toyota’s in terms of wants and needs, and whose factories were on a smaller scale that Toyota could more easily learn from [25]. This would have been much more relevant to Toyota from 1935 to the late 1950s compared to Ford’s customers and Ford’s expansive, vertically integrated production facilities.
Notes
† One of Toyota’s great accomplishment has been in putting these ideas together to create a beautifully integrated management system, steadily improving it day-by-day, and then maintaining commitment to the system through generations of managers. However, it is clear they have stumbled badly in recent years. Their self-imposed high growth period from 1998-2008 seems to be the key factor that has led to numerous problems that will be difficult to correct.
[1] M.L. Emiliani, “The Origins of Lean Management in America: The Role of Connecticut Businesses,” Journal of Management History, Vol. 12, No. 2, 2006, pp. 167-184
[2] B. Emiliani, REAL LEAN: Critical Issues and Opportunities in Lean Management, Volume Two, The CLBM, LLC, Wethersfield, Conn., 2007, Chapters 1-4 and 10
[3] B. Emiliani, REAL LEAN: The Keys to Sustaining Lean Management, Volume Three, The CLBM, LLC, Wethersfield, Conn., 2008
[4] F. Woollard with B. Emiliani, Principles of Mass and Flow Production, The CLBM, LLC, Wethersfield, Conn., 2009
[5] G. Maxcy and A. Silberston, The Motor Industry, George Allen & Unwin Ltd., London, U.K., 1959, p. 94 (Figure 2). Used with permission. The shape of the curve is approximately that of a 90% experience curve, which means there is a 10% reduction in cost each time cumulative production volume is doubled. This is the book that led me (Emiliani) to Frank G. Woollard’s long-forgotten work in flow production in the 1920s British automotive industry. See note [4].
[6] Maxcy and Silberston, pp.86-93 and 98
[7] The book Toyota: A History of the First 50 Years (Toyota Motor Corporation, Toyota City, Japan, 1988), lists on page 506 under the heading “General Studies” a reference to G. Maxcy and A. Silberston’s book The Motor Industry. This book was important enough to Toyota executives to be listed in the company’s official history.
[8] T. Ohno, Toyota Production System, Productivity Press, Portland, OR, 1988, pp. 1-2. The original subtitle to Ohno’s 1978 book The Toyota Production System (published in Japanese by Diamond Inc., Tokyo, Japan) was “Aiming to Manage Free from Economies of Scale” (see Jon Miller’s explanations of the subtitle at http://www.gembapantarei.com/2007/06/10_common_misconceptions_about.html and http://www.gembapantarei.com/2009/01/the_toyota_production_system_by_taiichi_ohno_chapt.html). Ohno thought Toyota’s Production System invalidated or greatly undercut economy of scale thinking and the Maxcy-Silberston cost curve due to the dramatic reduction in set-up time, queue time, transportation time, etc., as a result of achieving flow.
[9] See Yasuhiro Monden’s books on operations and cost management in the Japanese automotive industry, for example.
[10] S. Hino, Inside the Mind of Toyota, Productivity Press, New York, NY, 2006, pp. 80-82
[11] M. Sato, The Toyota Leaders, Vertical Inc., New York, NY, 2008, p. 148
[12] Hino, pp. 80-82
[13] Maxcy and Silberston, p. 88
[14] The empirical studies conducted by The Boston Consulting Group in the mid-1960s to validate the experience curve are flawed because it reflects nothing more than the widespread practice of batch-and-queue processing and standard cost accounting (and under the narrow conditions that they examined, where product or industry growth rates were very high and prices were set by management; i.e. sellers’ market, price = cost + profit). See Perspectives on Experience, The Boston Consulting Group, Inc., Boston, MA, 1972. Confusion has arisen because the human experience of learning a new task can produce a similarly shaped curve. The Maxcy-Silberston automobile production cost curve and The Boston Consulting Group’s misnamed experience curve are identical, and both are independent of the growth rate of the firm or industry. The proper name for these would be the “batch-and-queue curve,” as distinct from the “human experience curve.” The reason why Ohno viewed a firm’s growth rate as relevant to the Maxcy-Silberston automobile production cost curve is as follows: High growth amortizes waste, unevenness, and unreasonableness rapidly over a large volume of goods produced in a short period of time at prices set by the manufacturer (i.e. sellers’ market), which customers are willing to pay. When conditions reverse and a buyers’ market emerges, customers are no longer willing to pay the prices set by manufacturers, nor are they willing to pay for activities that add cost but do not add value. Therefore, Toyota’s production (and overall management) system, which seeks to eliminate waste, unevenness, and unreasonableness, undercuts the need for scale that would otherwise be necessary to enable a manufacturer to produce goods at low cost. In other words, the need for scale in operations diminishes as the amount of waste, unevenness, and unreasonableness diminish and flow improves (see Figure 2). Frank G. Woollard recognized this effect when he established flow production at Morris Motors Ltd. (like Toyota, in vertically disintegrated production – which is very different than the vertically integrated Ford Model T production at Highland Park) in the mid-1920s (see note [4]).
[15] In his 1960 review of the book The Motor Industry, John B. Rae wrote that “…[the author’s] work is excellent; their book can be rated as indispensable.” In the chapter analyzing the economies of mass production (Chapter 6, pp. 75-98), Professor Rae said: “…[the chapter] is done with a thoroughness that has not to my knowledge been applied to the American automobile industry.” This illustrates how even skilled book reviewers can miss important details. See J.B. Rae, “Book review of The Motor Industry by G. Maxcy and A. Silberston,” The Economic History Review, Vol. 13, No. 1, 1960, pp. 132-133.
[16] It appears Toyota continues to use the Maxcy-Silberston automobile production cost curve – created in the era of mechanical vehicles powered by internal combustion engines made using 1950s production technology – in this new era of electro-mechanical vehicles powered by gas-electric hybrid, electric, and hydrogen systems made using contemporary production technologies.
[17] This view may be driven by the capital intensive nature of automobile production and the widespread use of standard cost accounting.
[18] Success breeds complacency, and what better measure of success is there than higher sales?
[19] To understand the madness that can occur when top executives become fully possessed by the spell of economies of scale thinking, you must read “The Mega Containers Invade,” John W. Miller, The Wall Street Journal, 26 January 2009. This is one example of what I call a “durable” error. It is the type of error in management thinking that survives for decades through generations of managers.
[20] T. Fujimoto, The Evolution of a Manufacturing System at Toyota, Oxford University Press, New York, NY, 1999, pp. 206-222
[21] Achieve flow not just in production, but in all activities in the enterprise, in a non-zero-sum fashion, consistent with the “Respect for People” principle.
[22] In a 1972 paper, Aubrey Silberston provided a detailed technical analysis of economies of scale (“savings of resources associated with large scale”). His analysis vividly illustrates an enormous disconnect between how economists understand economies of scale compared to the simplistic manner in which executives comprehend and seek economies of scale. Unfortunately, the paper is also rich with so many qualifications, and misses key factors which can lead to diseconomies of scale (or the inability to save resources), that it renders the economies of scale argument as practically useless – details which executives are typically unaware of. Also, Silberston erroneously thought that all economies contributed to scale or were scalable. See A. Silberston, “Economies of Scale in Theory and Practice,” The Economic Journal, Vol. 82, No. 325, March 1972, pp. 369-391.
[23] Eiji Toyoda, the former chairman of Toyota Motor Corporation, was a principal advocate of the Maxcy-Silberston production cost curve. Despite his enthusiasm for the curve, Mr. Toyoda seemed to be aware that it could suggest to senior managers that they authorize production of many different products. In a 1998 interview of Eiji Toyoda, Takahiro Fujimoto asked the question: “What was your rule of thumb for deciding when to build a new plant? Did you have an upper limit in mind for production volume at each plant?” Mr. Toyoda’s answer is as follows: “…our basic unit of production capacity is about 20,000 vehicles per month… Twenty thousand seems to be some sort of natural economic unit… you can only sell 20,000 vehicles a month with each model if you have just a few models” [italics added]. In other words, an automaker must not produce too many models; if it does, then it cannot reach the “natural economic unit” of 20,000 vehicles per month in production. Apparently Toyota senior managers did not share Eiji Toyoda’s concern and thus produced too many models and created too much production capacity between approximately 1998 and 2008. Source: The Birth of Lean, K. Shimokawa and T. Fujimoto, editors, The Lean Enterprise Institute, Cambridge, MA, 2009, p. 252.
[24] Sato, pp. 132-133.
[25] One of Toyota’s long-standing strengths has been to gather intelligence from many sources – competitors, suppliers, customers, analysts, academics, etc. – carefully evaluate this information, and then put it to practical use. Their study of books such as The Motor Industry and competitor’s products and production systems helped them become who they are today. The question is, will some information, such as the Maxcy-Silberston cost curve (the experience curve), still be useful tomorrow?
M.L. “Bob” Emiliani is President of The CLBM, LLC. Bob worked for 20 years in manufacturing and service industries, and has implemented Lean principles and practices on the manufacturing shop floor, in supply networks, and in higher education (academics). Bob has authored seven books and over 30 papers on various aspects of Lean management. Copyright © 2009 by M.L. “Bob” Emiliani.